OBSERVATION + ITERATION = CONVERSION
Launching your website is the beginning of the process, not the end.
After months of discovery, content, design, and development your site is launched! This is an exciting time. After all the hard work, your vision is out in front of your audience. Now what?
If you are taking a set it and forget it approach to your website, you are losing potential customers!
The main goal of your website should be to get a site visitor to perform an action. That action in the web world is called a conversion. Conversions could be:
📝 Filling out a contact form
🗓 Scheduling a call
💰 Buying a product
⬇️ Downloading a PDF
📱 Calling your number
✉️ Joining your newsletter
“So how do I increase conversions?”
The first step is collecting data on how your users are interacting with your conversion page.
- How far down the page are they getting?
- How long are they on the page?
- What are they clicking on?
- What aren’t they clicking on?
- What is stopping them from moving forward?
You distill all that data into a plan of action. Maybe you find you need to:
- Add a pop-up to your site.
- Remove unnecessary form fields.
- Add testimonials, reviews, and logos.
- Remove distractions.
- Make the initial step really easy.
- Add a third-party signup service.
- Strengthen your CTA copy.
- Add live chat to your site.
- Reorganize the page to get CTA’s higher up the page
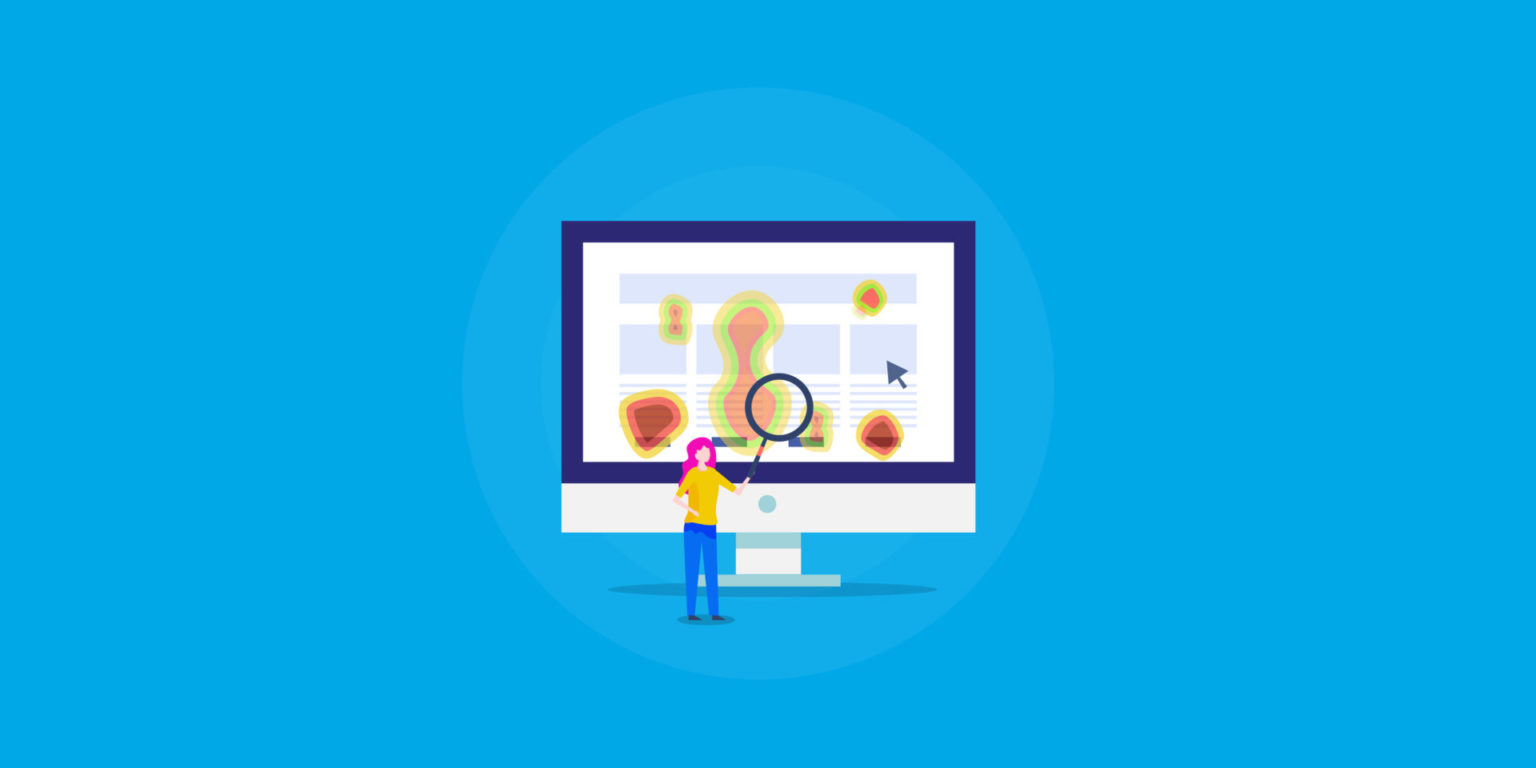
INTRODUCING DEKSIA’S ON PAGE CONVERSION OPTIMIZATION
We’ll take care of the whole process:
• Data Gathering
• Launching changes to your pages
• Monitor success and repeat
Price: $1000 per time cadence (can be weekly, monthly, or quarterly)
OUR CONVERSION OPTIMIZATION PROCESS
Define Baselines
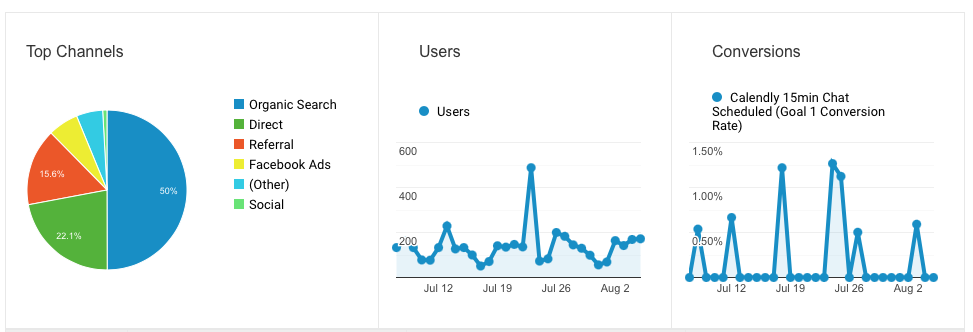
- Decide on a cadence that works best for your traffic and budget (weekly, monthly, quarterly)
- Set baseline metrics: # of visitors, # of conversions, Average time on page
Gather & Interpret Data
Heatmaps
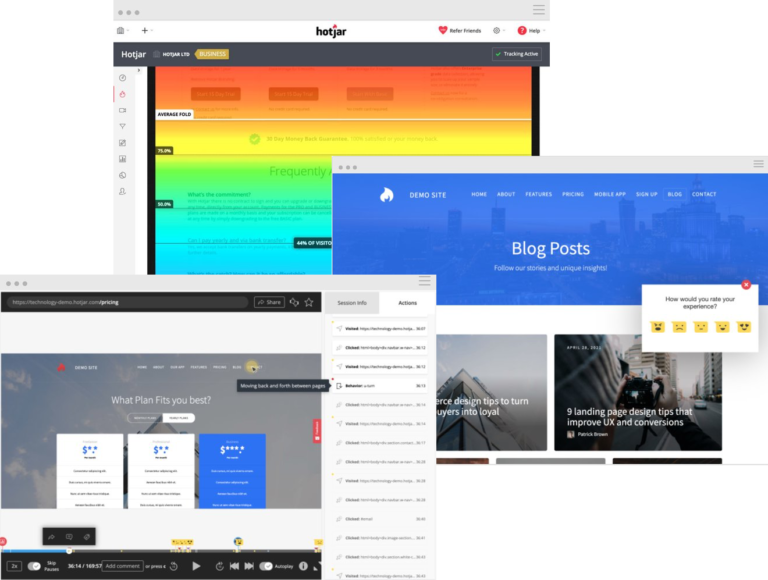
Heatmaps show you user movements and interactions (like clicks and scrolls) across your product or website. They complement conversion data by giving you detail on exactly where you’re losing or engaging users on every single page.
Surveys
Customer Satisfaction Score (CSAT) surveys give you a concrete metric on how satisfied customers are by asking them for pre-defined responses (usually yes/no or a happy/sad face). You can tailor your surveys to particular products, features, or design elements, or ask about the general user experience.
CSAT surveys help you better understand your conversion rate by understanding which aspects of your product leave customers satisfied or dissatisfied.
Session Recordings
With session recordings, you see what your users see and get inside their heads by witnessing every click, u-turn, and scroll they make.
Session Recordings are useful for spotting website bugs or pain points and coming up with immediate solutions—but they also help you make sense of broader analytics, like conversion rates.
Watch as users drop off the funnel, and you’re one step closer to figuring out why they dropped off—and how to stop it.
Make Impactful Changes
Whether it’s adjusting copy, colors, layouts. Providing more detail, providing less detail. We’ll make changes that move the needle for you users to convert.
Examples:
- Add a pop-up to your site.
- Remove unnecessary form fields.
- Add testimonials, reviews, and logos.
- Remove distractions.
- Make the initial step really easy.
- Add a third-party signup service.
- Strengthen your CTA copy.
- Add live chat to your site.
- Reorganize the page to get CTA’s higher up the page
- & Many More
Measure & Repeat
Report on success and repeat the process.
